








How to Compare Grease Additives When Treat Rates Are Not Equal
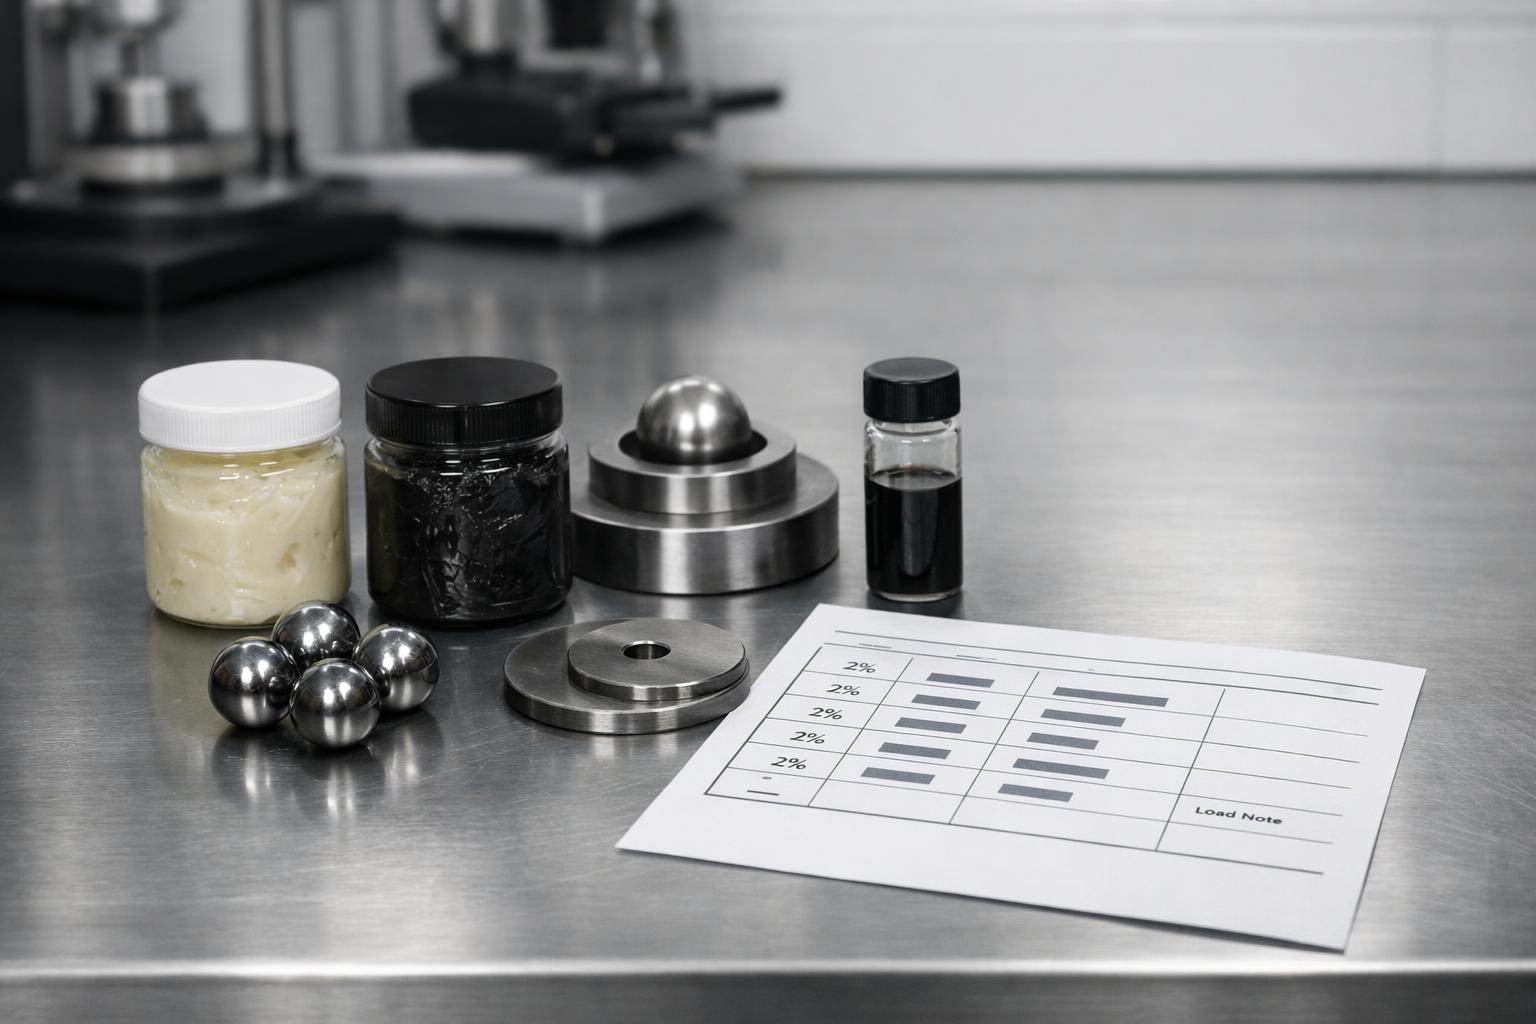
When a grease additive posts a strong ASTM D2596 result, many buyers look at the weld point first and everything else second.
That is backward.
The first question is whether the comparison was run at equal loading.
If one additive is tested at 2.5% treat rate and another is tested at 10%, the comparison is no longer only about chemistry. It is also about formulation loading, grease structure, processability, color, oil bleed, and total cost to reach the target.
In Powderful's current X730 source set, Torvix X730, a WS2 + MoS2 + hBN synergistic blend, reached 800 kgf at 2.5% treat rate, while the approved baseline in the same ASTM D2596 comparison is standard 2H MoS2 at 10% loading reaching 620 kgf. Lab and field results vary by application and conditions.
That is a meaningful result. It is also a result that needs to be read carefully.
Why Treat Rate Changes the Meaning of an EP Result
In grease formulation, additive loading is never a side note.
Higher treat rates affect more than raw material cost. They can also change:
- the amount of room left for the rest of the additive package,
- grease consistency and thickener balance,
- bleed behavior,
- visual appearance and color,
- processing time and dispersion effort,
- the economics of a commercial finished grease.
That means a comparison between 2.5% and 10% is part performance comparison and part formulation-efficiency comparison.
If the lower-loading system posts the higher weld point, that deserves attention. But the right conclusion is not simply "this additive is better." The better conclusion is that the lower-loading route may offer a stronger loading-to-performance balance in the tested system.
What the Current X730 Source Set Shows
The current X730 data is useful because it is not built around one isolated number. The same source set shows a treat-rate progression in a LiX base grease system:
- 0.75% Torvix X730 reached 250 to 315 kgf.
- 1.5% Torvix X730 reached 500 kgf.
- 2.0% Torvix X730 reached 620 kgf.
- 2.5% Torvix X730 reached 800 kgf.
That progression matters because it shows the result is not a random outlier. It shows the EP ceiling rising with loading in a way formulators can actually work with.
The approved baseline matters just as much. In the same reported comparison, 10% standard 2H MoS2 reached 620 kgf. That is the real anchor for the X730 claim because it forces the reader to compare performance and loading together rather than treating the headline number by itself as the whole story.
How to Read Unequal-Loading Comparisons Fairly
A fair reading of unequal-treat-rate data usually starts with four questions.
1. Was the method the same?
If both samples were run in ASTM D2596, the comparison starts on firmer ground than a comparison assembled from unrelated brochures.
2. Was the base grease system the same?
Same method is not enough. The comparison becomes far more useful when both results come from the same source set and the same grease system.
3. What changed besides the active chemistry?
If the data does not make the comparison conditions clear, interpretation gets weaker fast. Formulators need to know whether the variable was mainly chemistry, loading, or multiple formulation changes at once.
4. Does the lower-loading route still win after the rest of the formulation constraints come back in?
That is the commercial question. A lower-loading route matters only if it still behaves well on wear, stability, appearance, and plant handling.
What the Result Does Not Automatically Prove
This is where technical discipline matters.
The X730 ASTM D2596 result does not automatically prove that every grease using X730 will outperform every grease using MoS2. It does not prove that every thickener system will respond the same way. It does not prove that the same ranking will hold under water washout, long-duration wear, oxidation, or field service.
What it proves is narrower and more useful:
in the reported test system, under the reported method, the X730 chemistry delivered a higher EP ceiling than the approved MoS2 baseline while using substantially less additive.
That is enough to justify serious formulation work.
It is not enough to skip validation.
What a Formulator Should Validate Next
The disciplined next step is a matched follow-up plan:
- Run the incumbent and candidate in the same base grease.
- Compare more than one loading level instead of only the supplier's best headline number.
- Pair ASTM D2596 with ASTM D2266 or another relevant wear screen.
- Check what the additive does to consistency, bleed, and processing before scale-up.
- Confirm the result in the product category that actually matters to the customer.
This is the same reason formulators benefit from reading related guides such as WS2 vs MoS2: Which Solid Lubricant Is Right for Your Application? and What Is the Difference Between WS2, MoS2, and hBN Solid Lubricants?. Chemistry choice and treat-rate choice should be evaluated together, not in isolation.
The Practical Takeaway
If two grease additives are not tested at equal loading, the comparison is still useful, but it has to be read as both a performance result and a formulation-efficiency result.
That is why the approved X730 claim deserves attention. A WS2 + MoS2 + hBN synergistic blend reaching 800 kgf at 2.5% treat rate against an approved baseline of 620 kgf for 10% standard 2H MoS2 is not just a larger number. It suggests a different loading-to-performance balance in the reported grease system.
The right next step is not to copy the headline into a slide deck and stop there.
The right next step is to run the side-by-side trial properly, normalize the comparison where it matters, and decide whether the lower-loading route still wins once the full formulation constraints are back on the table.
If you are planning that comparison now, review the Powderful product line and contact us for sample planning and technical guidance.
Performance figures are based on internal laboratory testing and field studies under specific conditions. Actual results vary depending on application, operating conditions, equipment age, base oil and additive package, ambient environment, and formulation. Figures shown are not a guarantee of savings or performance any individual user will achieve. Test before scaling.